
KAIST AI 대학원 신기정 교수님의 수업인 데이터마이닝 및 소셜 네트워크 분석 수업 필기입니다.
Three parts/goals
- Statistical properties of large networks
- Models that help understand these properties
- Predict behavior of networked systems based on measured srtructural properties and local rules governing individual nodes
Random Graph: Null Model
- What is the simplest way to generate a graph?
- Random graph model \(G(n,p)\) (= Erdos-Renyi model, Poisson random graph model)
- Given \(n\) vertices, connect each pair i.i.d. with probability \(p\)
Paths / Distance in Graph
- Path: Sequence of nodes between the two nodes
Can intersect itself and pass through the same edge - Distance: the number of edges along a shortest path
Not connected, the distance is usually defined as infinite
Network Diameter
- Diameter: The maximum distance between any pair of nodes in a graph -> sensitive to outlier
- Effective diameter: distance at which 90% of all connected pairs of nodes can be reached
- Average path length for a connected graph or component

Small-world Effect
- 약 6번의 path를 건너면 거의 모든 사람들과 연결되어 있다는 이론(Diameter in social network)
EX) Boston에 편지보내기, MSN


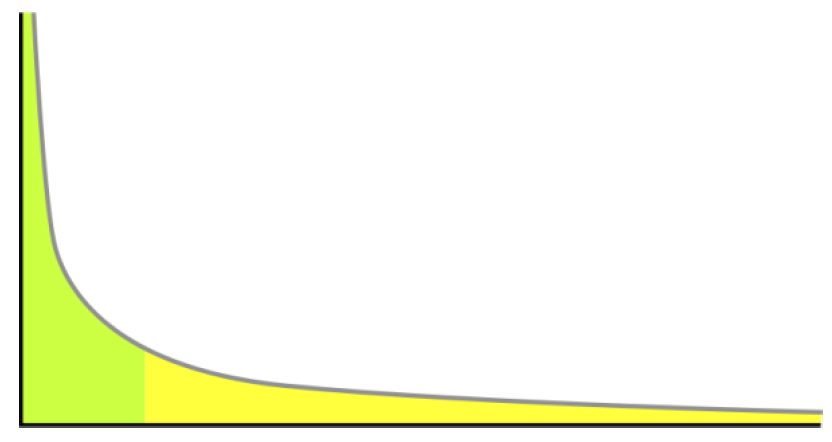
Degree Distribution
- Degree Distribution \(p_k\): Fraction of node with degree \(k\)
$$ p_k = N_k / N $$

- Degrees in real graph: Heavily skewed to the right
Long tail of values far above the mean
many real world networks contain hubs
A power-law distribution: \(p_k ~ k^{-\alpha}\)
- Degree distribution in random graph: binomial
$$ P(k)={n-1\choose k}p^k(1-p)^{n-1-k} $$
approximately nomarl distribution

Clustering Coefficient
- Local Clustering Coefficient of node \(i\) with degree \(k_i\) -> 인접노드들끼리 얼마나 연결되어 있나
$$ C_i := {e_i\over k_i(k_i - 1)/2} $$ - Average Clustering Coefficient
$$ C := {1 \over N} \sum C_i $$ - In real-world graphs
Expected value CC: \(C >> {2m \over N(N-1)}\)
Why?
Homophily: nodes connect to nodes similar to themselves(같은 관심사가 있으면 친구 됨)
Transitivity: nodes with common friends become friends(공통의 친구가 있으면 친구 됨)
Giant Connected Component(GCC)
- Largest set where any two vertices can be joined by a path
- In real world graphs, huge GCC contains most nodes


- In Random Graph \(G(n,p)\)

Difference between real-world graph and random graph
- Degree distribution: Heavily skewed to the right vs Gaussian Distribution
- Avg path length: 비슷
- Avg clustering coef: real-world graph가 더 높음
- Largest Connected Componet: 일정수 이상의 node가 존재하면 비슷
Network Resilience
How the connectivity of the network changes as the nodes get removed?
- Real graphs are resilient to random attacks
- Real graphs are vulnerable to targeted attacks(GCC가 attack 받으면 취약)
- Randm network는 real network에 비해 target attack에 robost

How Graphs Evolve over Time
Conventional wisdom/intuition
- Constant average degree: the number of edges grows linearly with the number of nodes
$$ E(t) \propto N(t) $$
\(E(t)\): number of edges at time
\(N(t)\): number of nodes at time - Slowly growing diameter: as the network grows the distances between nodes grow
$$ O(N^{1/3}) \; or \; O(logN) $$
Real Network
Networks are denser over time(denser = \({E(t) \over N(t)}\))
- the number of edges grow faster than that of nodes
- average degree is increasing
$$ E(t) \propto N(t)^a $$

Diameter shrinks over time(= people get closer over time)

'GraphMining' 카테고리의 다른 글
| Kronecker Graph Model (0) | 2022.09.26 |
|---|---|
| Community Guided Attachment & Forest Fire Model (0) | 2022.09.26 |
| Basic Models (0) | 2022.09.14 |
| Random Networks (0) | 2022.09.14 |
| Intro & Basic Concepts (0) | 2022.09.06 |